Your accounting system already has artificial intelligence built in. After all, all that AI does is analyse data and make predictions. All that financial data already exists and is in your accounting system.
Reporting is the interface between artificial intelligence and human intelligence. Reporting is data moulded into a format that provides answers to key questions.
Actually, all of our questions in a business can be boiled down to one which might be phrased in many different ways depending on our particular business focus.
How can I make more money?

By applying the right tools to your accounting data, you can leverage it into becoming the most valuable asset your business has.
Artificial intelligence sounds expensive, but you probably have the tools right on your computer there in front of you. Your spreadsheet program, your report writer, your accounting system – all these tools, when used together, can provide you with that “artificial intelligence”.
My assumption in this article, is that your accounting system holds all the information that we would expect an accounting system to hold. Sales information, products and stock, purchasing and time management. Even if it doesn’t hold all this information, much of what we discuss here is relevant and useful.
Sales Analysis Reports
When you close your sales ledger off for the month, you will typically print a sales analysis report. Which is usually used for reconciliation, maybe for the VAT return – maybe to make sure everything has been billed – but it’s not all it can do.
This report, depending on your accounting system, can be an incredible source of information and a foundation on which you can build some real strategic decision making.
Sales Analysis by Customer
This is a list of what each client has been billed (not necessarily paid) over the course of the previous month. This is a great way to trend a client’s spending patterns and detect issues before they become critical.
If you have a client that regularly spends more than £5,000 a month with you and then suddenly, those sales fall off to a couple of hundred pounds a month – it’s a sign that something is wrong.
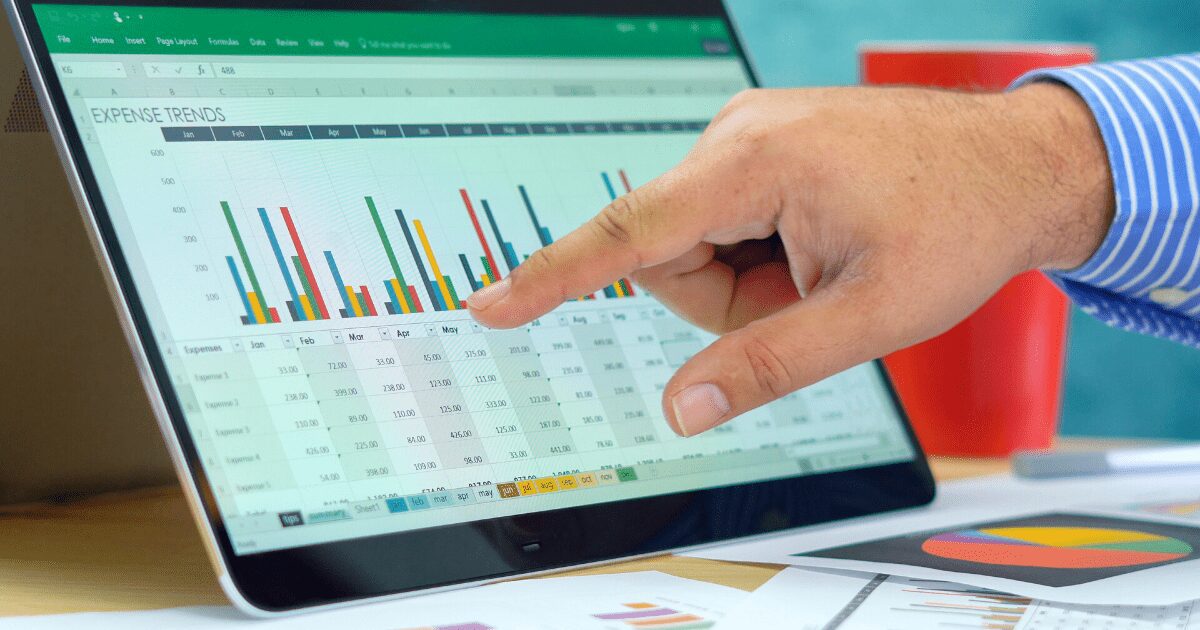
By pulling that sales analysis into a spreadsheet on a month by month basis, you can add formulas which will detect variances over a certain percentage, with the magic of spreadsheets in mind – you could have a single page summary of the top 10 increases and decreases (variances) and this can fuel your account management activities.
Sales analysis by customer is a great tool for account management and a planning tool that can significantly add to your bottom line.
This doesn’t have to be a long report, if you ask the right questions, you could end up with a list of 20 customers (top ten increases and top ten decreases) will give you a great starting point.
In addition to writing the report and having it available, it’s important for your account managers to set aside time to look through the figures and come up with a plan.
Have your account manager schedule in time for those twenty calls every month – put it in the diary and make sure it happens.
I am not suggesting that you phone up your customer and ask outright – why haven’t you spent as much as usual, but it might be worthwhile just reconnecting and letting them know you care.
Sales Analysis by Region
If yours is a larger business, then you may want to review how each sales region is doing. Once again, a report that not only details what each region has sold but adds in variance can give an early indication of issues within certain regions.
This may be by department, by region, by salesman (by salesman and by client) – the important thing is not that it is produced and emailed round but that someone has the responsibility for turning the artificial intelligence into human intelligence to guide the sales force and the business.
Sales Analysis by Product/Service
Sales analysis by product can give you an idea of popular products and sales patterns that you can leverage to make more profits.
With this report, I would add margin to the mixture – each product listed with its profit margin (actual margin as opposed to predicted), how many sold how much profit made – compared month on month.
How about a report that runs to how much of each product did you sell to each client over the course of the year?
Running an IT business for all those years taught me the importance of this kind of report. Seeing what a client bought or didn’t helps you to mould your offerings to that client or maybe even offer alternative services. Also how many times do you hear – “ooh I didn’t know you did that too”
However, if you run a retail business or a catering business this report can also be leveraged in several other ways.
Average units sold per Monday lunchtime? How many times did you discount the product to get rid of it? Which locations sold the most? Depending on your till system all this information is available and can be reported on.
Using analysis by product can help reduce waste and inform ordering decisions and increase profit by making sure you have enough items in stock to meet the demand.
As a service business, if you get the reporting right you can see which services you are providing are the most profitable. Usually this won’t surprise you, but sometimes…
I remember a period whilst I was running a small office support business when we seemed incredibly busy – I was on the phone constantly, a lot of revenue was being billed and it felt like we were doing well.
The service we were selling was fairly simple, an ink jet printer with free installation, We had a decent margin on the printer and I had calculated that we could spend an hour onsite installing the printer and still be up – not by a lot but by enough to make it worthwhile.
After 60 printer installs in a fortnight, I ran my analysis report and discovered something – I had not made any money at all! After taking into consideration jobs that over-run, salaries, travel costs – each job was on average just about break even!
The Sales Analysis by Product or Service is a way to keep yourself informed of exactly how healthy your business is.
Assign the Time
Getting the reports written so that they match what you want from your system can be hard work and getting the help of your local ERP/Accounting system support person may well be needed to get them just right. It’s in these areas that spending a little bit of time and money now, can add significantly to your bottom line later.
The other investment here is management time, time set aside to read the reports and plan what you are going to do about it. So often we spend our days firefighting and clawing and gouging our niche in the world that we miss out on these fundamentals of our business.
One Business Coach I dealt with a few years ago gave a great and simple piece of advice. Find out where your money comes from – and do more of it.
Sales analysis is a key part of making that happen – it’s the business intelligence needed to make this work.
Free Excel Templates

If you would like to receive a pack of Excel Templates that you can use as the basis of your sales reports – then please drop me a line and I will be happy to share.
If you would like someone to come and look at your business reporting and make it “useful” then let me know.
Sharif George is an experienced ERP and CRM support manager with over 30 years experience delivering bespoke and turnkey software solutions and support to small and medium sized businesses.
Special thanks to Nick Rose from Complete IT for his insight into the reporting periods and EPOS.
If you would like more information, contact us today!
Written by Sharif George.


