


Microsoft Power BI
Gain a 360 view of your organisation with Power BI
What is Power BI?
Microsoft Power BI, part of the Microsoft Power Platform is a powerful business intelligence solution which allows organisations to create, automate and optimise insightful dashboards and reports, in easy to digest visuals.
You can connect to hundreds of sources in one place, reducing the complexity of using multiple analytics systems.
We all deal with data daily but trying to make sense of all the data that we process can be a complex and time-consuming challenge with input needed from multiple departments.
With Power BI you can make instant sense of data from easy to process visuals, allowing your team to discover insights, uncover trends and understand what influences your KPIs.
You’ll get the big picture and will be able to share critical data, ask important questions and make decisions, driven by data which will help you to achieve a competitive advantage.
Key Features
Easy to understand visuals
Simple charts and graphs which are easy to understand and can help you make important business decisions, based on data.
Have full control of who has access
Admins will have full visibility of who can access sensitive data and can implement restrictions where necessary.
Saves you time
Spend more time getting answers, rather than collecting the data itself, so you can improve your use of time.
Connect with multiple sources
Connect with hundreds of data sources such as Excel, Dynamics 365, Salesforce & Google Analytics to create insightful live reports, reducing the complexity of using multiple systems.
Updates in real-time
Dashboards and reports will automatically update in real-time, so that you discover important insights as they are happening – allowing you to adapt and improve.
Get quick insights
Control who has visibility of data
How it works
- Complete our Power BI overview form, which covers the solutions and systems that you’re using, the type of reporting that you’re looking to achieve and the challenges that you’re trying to overcome.
- Our consultants will review the information and prepare a set of tailored questions, based on your solutions, requirements & challenges.
- We’ll arrange a short introductory call with you to discuss your requirements further and to run through our questions.
- We’ll prepare a tailored services proposal that sets out the costs to deliver the desired reporting built around your specific needs.
What can you do with Power BI?
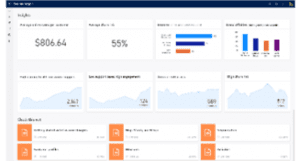
Power BI empowers you to unlock insights from your data sources and gives you the knowledge to make smarter business decisions, based on data.
Predict customer intent
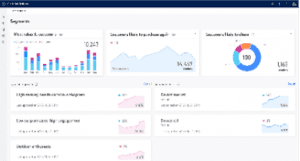
Spot trends and patterns
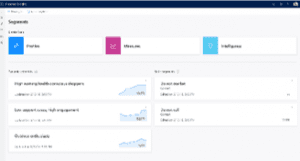
Create richer customer segments
Drive personalised experiences across channels
Automate customer-centric experiences and processes
See Power BI in action
Discover how easy it is to turn your business data into insightful dashboards and reports with Power BI.
Complete I.T.’s experience using Power BI
Why we use Power BI
Microsoft Power BI is a business analytics platform that aims to provide interactive visualisation and business intelligence in an easy to consume format. It can take thousands of pieces of information and present them in easy to digest visuals, that you can learn from.
Over the years, Complete I.T. has used a variety of tools that have fulfilled this purpose to various extents but in 2020, we decided to invest in the Microsoft Power BI platform for a number of reasons:
- It could pull data in from various sources; including our CRM system (ConnectWise), Hubspot CRM, Crewhu (our helpdesk feedback system) and a number of legacy spreadsheets we use,
- It is a scalable solution through our Microsoft 365 licensing,
- It is visually pleasing and can be displayed on dashboards in our offices.
How Complete I.T. has improved their support with Power BI
As an example, Complete I.T. wanted to use our helpdesk ticket data within Connectwise to better understand the demand for our helpdesk service over the year, with the aim to improve processes, planning and implementation.
To give you some context, Complete I.T. closes between seven and eight thousand helpdesk tickets every month and this does not include those tickets that are logged/dealt with by our automated systems.
As an Excel spreadsheet, that’s 8,000 lines with 20-30 columns of data – 240,000 pieces of data in just one month! As it is, this information is not useful which is where Power BI comes in, to create easy to process visuals.
We were able to see that we were:
Quieter in the summertime and in December
- Which means we will encourage the team to take annual leave during these periods,
- Bring in additional team members to cover busy periods if we operated a lean helpdesk model.
Busiest at the beginning of the week
- Front-load any part-time team members towards the beginning of the week,
- Encourage the team to take annual leave towards the end of the week.
Busiest in the morning
- We could plan our shift patterns, so we had more people in in the morning and less in the afternoon,
- Encourage the team who might want to take a half-day annual leave to do it in the afternoon.
Power BI allowed us to look at our productivity, on an office level, team level or individual level which we can learn from and put processes into place which better allow us to support our clients.
These reports will also automatically update so if there are any changes to patterns, we will be able to pick up on this, as and when they are happening.
Power BI Webinar with Microsoft
In this webinar, we were joined by Paul Henwood, Cloud Solution Architect in the One Commercial Partner Team at Microsoft. Paul explains what Power BI is, why it is useful and gives a live demo of Power BI in action.
Watch the recording now to learn how your organisation can make smarter business decisions and drive results.
Did you know…
41% of businesses struggle to turn data into decisions*
15% of companies feel like they have a complete view of customers*
61% of customers stopped doing business with at least one company because of poor customer experience*
Why is it important to make business decisions based on data?
Data driven decision making empowers organisations to create new business opportunities, improve the current process, generate more revenue and enables them to make predictions of future trends based on the data they already have.
Organisations that have access to insightful dashboards and reports of data, at their fingertips, tend to be more competitive and are able to identify trends and issues as they arise. This helps maintain customer satisfaction levels, help with business growth and client retention.
Microsoft Power BI FAQs
What is Microsoft Power BI?
Power BI by Microsoft is one of the tools within the Microsoft Power Platform. Microsoft Power BI is an enterprise business intelligence (BI) and analytics solution that transforms your data into visuals with advanced data-analysis tools, AI capabilities, and an easy-to-use report creation tool. Power BI allows you to create datasets and add them to a centralised hub, which essentially becomes your one source of truth for data.
I’m looking for a Microsoft Power BI Consultant, can you help?
At Complete I.T., we have a dedicated Business Applications Team who can support you on your Power Platform journey, including Microsoft Power BI. They will start off by addressing the key question of ‘what is Microsoft Power BI?’ ensuring you have an understanding of what this tool is and how it benefits many organisations, before understanding the current systems you are using, the type of data reporting you are looking to achieve and any challenges that you are trying to overcome that Power BI by Microsoft can help with.
Your Microsoft Power BI consultant at Complete I.T. will absorb all of the information you have given them, making sure to address any questions they have around your requirements and challenges before preparing a bespoke proposal that sets out the costs to deliver the desired reporting built around your specific needs.
What can I do with Microsoft Power BI?
- Create one source of truth – connect all your different data sources in one place to establish a single source of truth
- Infuse data experiences everywhere – bridge the gap between insights and decision making
- Empower your team to work with data – ensure everyone can explore data with a simple user interface, free training resources and a vast selection of accessibility features
- Embed BI reports for your clients – improve usage and engagement in your own apps by using Power BI embedded to embed stunning visual reports
- Get started straight away – start quickly with a simple-to-use creation experience, AI-generated reports and hundreds of report templates to choose from!
Power BI from Microsoft may sound complex at first if you are not technical, but your dedicated Microsoft Power BI consultant from Complete I.T. will ensure everything is set up correctly for you, showing you how to use it properly and effectively so that you get the most out of it and transform your data into valuable insights! The Power BI Microsoft solution was designed for self-service so that once it’s set up, it’s easy for the entire team to access and use.
What are 3 key features of Power BI by Microsoft?
- Data Connectivity – Power BI provides users with a range of data connectivity options, enabling easy access to data from different sources from spreadsheets to databases and even social media channels, Power BI from Microsoft offers seamless connectivity. Users can easily extract and combine data from multiple sources, allowing for the creation of visually appealing dashboards that provide a holistic view of the organisations data landscape, allowing for the use of data-driven insights to make impactful decisions.
- Interactive Visualisations – Power BI allows users to transform otherwise complex data into meaningful and easy-to-understand visual representations. These visuals can be customized, from a selection that includes charts, tables and graphs, to present data in a more fun and engaging way. Power BI by Microsoft updates in real-time, so that any modifications are immediately pulled through and updated on the visual. This allows for data interpretation as well as storytelling, as users can explore and uncover insights through interactive exploration of the visualisations.
- Security and Data Governance – Power BI from Microsoft provides security measures that ensure users can only access data that they are authorised to view. It also allows you to define and enforce data policies, ensuring data quality and consistency across your organisation. You can set up data classification and sensitivity labelling, permitting better control over data access and usage. Power BI’s auditing and compliance features help you track and monitor data activities, ensuring adherence to regulatory requirements.
Complete I.T. Blog

What Is Power BI: How You Can Transform Data Analysis With Power BI and AI
In today's digital age, the combination of artificial intelligence (AI) and advanced analytics has revolutionised how organisations harness the power of data for strategic decision-making. At the forefront of this transformation is Microsoft's...

How to Create a Smarter Workplace With the Microsoft Power Platform
When it comes to our day-to-day processes in the workplace, we often get stuck into routines and don’t like change. Plus, why fix something if it isn’t broken? If you could save time & money, improve customer satisfaction, and reduce errors,...

Power Automate: Webinar
Tristan Broom, Head of ERP at Complete I.T. was joined by Ana Demeny - Senior Cloud Solutions Architect at Microsoft, in this webinar to talk about Power Automate and how it can help empower your organisation. Power Automate is part of the...